Lesson Study: Lines of Best Fit

I had the privilege of working with Integrated 1 teachers last week on statistics. We voiced our concern that students are often given the line of best fit for a data set rather than exploring how to create it themselves. We also wondered why their stats chapter was not right after exploring equations in slope-intercept form, as that how we wanted students to write the equation for the line they created.

Our goals for creating the lesson were as follows: 1) Students would review writing a linear equation in slope-intercept form from a graph, 2) Students would create lines of best fit for data plots on a graph, and 3) Students would write the equation for the line of best fit in slope-intercept form.

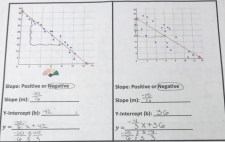
After searching several open resource sites, we settled on using some graphs from an earlier exploration to review writing equations of lines (please see the attached worksheet). We felt that these graphs would be easier for students to be able to read, and allowed students to determine the slope either by counting or by using their slope formula when given two points. We didn’t want the lesson to get stuck in this review section, so the cleaner the graphs were, the better. We strategically chose two with positive slopes, two with negative slopes, some with fraction values and one with a y-intercept of 0 so that we could frontload the necessary skills before moving to the new concept of creating lines of best fit.

The second component of the lesson was the Desmos activity, Fit Fights (see link below). We wanted to use the activity to build understanding for how lines of best fit are created. We used the following questions to drive the discussions:

  • What do you notice?
  • What do you think the gray lines represent?
  • Do the data points make a line if we connect them? Is this a linear function? Why or why not?
  • Do the data points gravitate towards making a line? Would it be a positive or negative (or zero or undefined for the graphs they created) slope?
  • If we drew a line to ‘best fit’ our data points, where might it go?
  • How can you tell if your line is a good fit for the data points?

The third component of the lesson was to relate the lines of best fit students created to writing equations of linear functions in slope-intercept form. We took snap shots of the lines of best fit from the Desmos activity, strategically choosing lines that had at least two whole number coordinates. We purposefully related the warm up to the lines of best fit, using similar language and questioning.

Our Take-Aways

  • Our students are successful in determining the slope by counting rise/run, but need to continue to work on using the slope formula when given two points.
  • The Desmos activity only had negative slope lines of best fit. Consider having students create data points that could have lines of best fit that have other correlations so they don’t overgeneralize and think it will always be a negative correlation.
  • Students struggle when the axis are scaled differently. Need to build in some warm-ups that continue to explore differently scaled axes.
  • We need to be clear in our questioning. Using questions such as, “Are we good? Do you get it?, etc.” does not give us formative information to move forward.

Below are some of the students’ work and what they felt they had learned. Overall, students were more engaged with this lesson than they have been in the past when learning this concept. We deflines of best fit 1initely want to use this lesson again, and hope you find it helpful as well!

lines of best fit 2


Desmos Fit Fights: https://teacher.desmos.com/activitybuilder/custom/5c5bc938531af975828d9e92

Lesson Study Worksheet (Shout out to Fontana High School!): Stats Lesson Study Worksheet


Lesson Study: Lines of Best Fit

How Do Our Beliefs in Math Affect Our Students?

I was honored to work with amazing teachers this week. We took a survey from NCTM (National Council Teachers of Mathematics) on our beliefs regarding student learning and our instructional practices in mathematics. This, in itself, led to amazing discussions about what we truly believe math IS and how we interpret that into instructional decisions within our classrooms.

But then we took it further. We got into groups and discussed not so much whether we agreed or disagreed, but whether it was a productive or unproductive belief in respect to student access and learning.  Here are two to consider:

There were fantastic discussions about these particular ones, especially for educators of EL and SPED. We also considered how parents might respond to these. Powerful conversations around access, flexibility in thinking, understanding conceptual and procedural mathematical ideas, and yes, fluency.

Here was the point. Our beliefs, whether productive or unproductive, affect our attitudes towards mathematics and the children we are blessed to teach. Those attitudes affect the actions we take. Who gets to answer which questions? Who gets the “tough” tasks and who has to keep doing drill and kill worksheets? Who gets to explore puzzles and who has to retake tests or do homework (because their home life doesn’t lend itself to being able to do it at home)? And those actions MATTER. They affect the results you will get from your students.

Belief chart

So as you gear up for this school year, consider taking the beliefs survey yourself. Even better, have your team take it and REALLY dive in to what beliefs are productive an unproductive. The more we reflect, the more we can grow and be effective at what we truly want; to teach students to love, learn and understand mathematics. Have a great year!

For the beliefs survey: 2017_06_19_Holstrom_Grady_2BeliefsSurvey


How Do Our Beliefs in Math Affect Our Students?

Quick Shows With Ten-Frames

I was asked to come in and work with small groups (4-5 students) in Kindergarten today using ten-frames. The teacher wanted students to unitize by 5, 10, and 15, counting on the rest by ones. For example, if I asked a student, “How many do you see? How do you see them?”, she wanted the students to understand that you could find the value in a variety of ways. Here are a few of the anticipated answers she wants them to give by the end of the year:14

  • I counted them all. One, two, …twelve, thirteen, fourteen (Level 1)
  • I saw two- 5’s, so 5, 10, 11, 12, 13, 14 (Level 2)
  • I saw a ten, so 10, 11, 12, 13, 14 (Level 2)
  • I saw 5’s and 1 missing. 5, 10, 15, (counting backwards) 14 (Level 3)

I had a deck of ten- and double ten-frame cards, so I decided to do some “quick shows”.  I would show a card to the kids for about 5 seconds, and they had to ‘think’ about their value (versus just shouting out the number). We rotated who gave the value first, but every child had to give the value they thought was on the card. I chose a different student to explain how they got the value, then gave every other student a chance to share their thinking. We did this for about 15 minutes per group of 4-5 students.

Here are our ah-ha’s:

  • Out of the 4 groups, only one group stayed within the single 10-frame. I was getting answers from this group that were bigger than 10 every time. For example, when I showed them a card with 8 dots, one said 8, one said 12, and the other two were still counting by ones. I quickly drew a double (or triple) 10-frame and grabbed some counters (plastic circle thingies) and would show them their answer, then the original card. That worked for all but one student. For him, I kept on the table the card with the ten-frame filled in, then did the quick show. That clicked for today, but I need to do some hands-on work with this group. I also need to go back to a 5-frame and really focus on 5+ values before moving beyond 10.
  • Students needed to be convinced that the two cards below each showed a value of 5. Great for starting the discussion about the commutative property! We rotated the card over and over until someone said, “It is just the same thing! You didn’t put more on or take any off. Geez!”

5 different ways

  • The sequencing of the quick show was instrumental in students building strategies beyond counting one-by-one. The order that seemed to work the best today was as follows: 3, 5, 5 (again, upside down), 4 (to see it was 1 less than 5), 6, 8, 10, 9, 11. Notice we kept them seeing 1 more/less so they could use that strategy as well.
  • For the groups that could “just see” the ten-frame, I worked up to 20. Here is the orde18
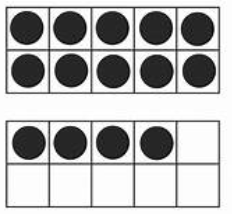
r we used with those groups: 3, 5, 5 (upside down), 8, 10, 12, 15, 14, 20, 18. 18 was tough (see the number of dots), as students really needed to push to 5’s versus  counting 10 then by ones.
  • One group finished about 5 minutes early, so we played war. That way, they each had a different card and had to tell me their value before determining who had the most dots. This was interesting, as they had the cards to touch and many reverted back to one-to-one counting. We will need to think about that for next time.

What I loved about this activity was that I had 15 solid minutes to informally assess each child. I heard what they understood and where they struggled. I was able to note for the teacher which cards each child got quickly, and which he/she reverted back to counting by ones (or guessed). Every child was engaged and had to listen to their friends as each shared out their strategy. And most important to me, every child left my group smiling, asking when I was coming back to do more “quick thinking”.

For large ten-frame cards: https://lrt.ednet.ns.ca/PD/BLM/pdf_files/five_and_ten_frames/ten_frames_large_with_dots.pdf

For double ten-frame cards: We made them by cutting/pasting two ten-frames together. I am sure you can buy the cards, but this was cheapest for us.

Quick Shows With Ten-Frames

Beyond Counting: Ideas and Activites For Your Little Ones

While waiting for his big brother at the orthodontist, my little boy, C,  had the following conversation…

Dr. T: How old are you, cutie?

C: I’m three!

Dr. T: How old is your brother (pointing towards my thirteen year old)

C: Four!

This was such a proud mama moment for me!

Now you may ask yourself, “Why is she getting all excited over this? Clearly, he is not four. Why is she so proud of her little boy?”

There are a number of reasons why this is a critical step towards numeracy. I truly believe that if you start children purposefully thinking about numbers early on, their chance for success in mathematics increases dramatically. So let’s highlight a few of the big ideas C is working towards.

bears

1. Cardinality– This is the idea that the number being used is measuring some amount. It answers the question, “How many?” For example, I can ask my son, “How many bears do you see?” He would count them one by one until he got to the number six. That last number, 6, tells you the number of bears in the set. This is a big deal! The child is no longer counting from memorization; he is recognizing that the number relates to a certain amount of “things”. The more things you have, the further you have to count. C recognized that his brother was older (or “bigger”). Therefore, his brother was tagged to a number after the one he identified with, three. He did not know how many more to go, just that he had to choose a number beyond his own. Cool.

2. Inclusion– This is the idea that the number labeling “how many objects” in a group includes all of the preceding numbers. So even though we have six bears, we can also think of it as “one and some more”, “two and some more”, “three and some more”, and so on. This is critical for addition and subtraction. If I have the number 14, I can think about it as “ten and four more”, which helps me when I want to add or subtract and regroup to make the problem easier. C knew that his brother was older, and therefore had to include his age (three) and some more. Again, he isn’t at the point of knowing how much more, but is on his way. Awesome.

3. Magnitude– The size of the object. In this case, a number (or value) given to a quantity (age) for the purpose of comparing with another quantity. This idea is instrumental for estimation, particularly with very large and very small numbers. In fact, one of the posts requested of me to write is helping students compare fractions. If a child does not know the relative size of the number they are considering then it is very difficult to compare, operate or manipulate it with any real fluency or number sense. How do I know my answer is reasonable if I haven’t a clue what the numbers I am working with represent??? For C, he was able to recognize that his brother had to be a larger quantity than three, because he is older. Super rad!

These three ideas are certainly related, but each has a different feel. You can work with them simultaneously, so long as there is purpose to the questions and tasks you present to your kids. Below are some simple, but powerful, activities you can play with your little ones to build these concepts. I choose the games that you can take on the road, to the doctor’s office, to a restaurant, etc. Instead of sitting around being squirrelly, play a game while you wait. Even five minutes will have a significant impact!

1. Count and Check: Grab a handful of ANYTHING (balls, pennies, beans, cheerios, etc) and ask your child to count how many. Make sure the amount of objects is appropriate. (For example, C is working on objects through 5.) When he finishes counting the last object, ask, “How many _____ are there?” If he cannot answer, that is okay! He is working towards cardinality. He is able to say the objects one by one (which is called one to one correspondence), but hasn’t figured out that the last number he says represents the entire amount. Have him count again, and ask again. If he cannot answer again, say, “There are (say the amount) ______ here.”  You can play this at the grocery store (count the apples, bananas, etc), setting the table (How many forks?), etc.

2. Match Me! Grab a die (one dice) and a handful of ANYTHING in a baggie. (I typically do this with pennies at restaurant.) Have your child roll the die. Let’s say she rolls a five. She takes out that many pennies and lays them out for you to see. Ask her to count them one-by-one to make sure she has five. At the end ask, “How many pennies do you have?” If she doesn’t know, that is okay! Have her recount, then ask again. If she still isn’t able to tell you, say, “I see you have five pennies.” Make sure you roll next and model for your child. Take turns until you get bored or dinner comes!

To bring the difficulty up, after playing each of these, ask, “If I gave you one more item, how many would you have?” This brings in the concepts of magnitude and inclusion! If your child has to recount with one more added in, that is fine! You know he’s got it when he can answer quickly without physically adding in another item and recounting.

Need another level of difficulty? Ask, “If I took away one of the items, how many will be left?” Same idea, but working backwards, and just as important!

Beyond Counting: Ideas and Activites For Your Little Ones