A group of seventh grade teachers and I were trying to figure out how to move from concrete representations of solving equations (some used chips/cups and some used tape diagrams) to the more symbolic procedural (traditional) representation. While students were able to model the “moves” with the concrete, some still struggled to move from that to solving on paper.
I had recalled a method a dear colleague, Bruce Grip, had shown me years ago using a flow chart. We decided to try it out ourselves.
Starting with expressions, we discussed what the “moves” are when simplifying. Order of operations made a showing, and we moved through the flow chart. We decided this was a valuable use of time, as it built understanding of the structure of numeric expressions and fluency with integers (Which, let’s be honest; they need LOTS of practice with!). 


From there, we decided to bust out a single step equation. We started the same way we did with expressions, using x as our starting value. “What moves am I making to x in this equation?” We then built our flow chart. HOWEVER, rather than simplifying (as in the expressions), we know the value we want to get. So the flow chart looks like this:

To solve for the value of x, we need to work back wards through our flow chart. If I had added 2 to a value to get -5, then I need to subtract that 2 to figure out what I started with. We could then parallel the flow chart with the more traditional algorithm for the students.
Below are several of our examples, limited to the structures seventh grade explores for CCSS.


We also explored some “messier” problems, as shown here. It illustrates the fluency with the distributive property piece of “When do I need to distribute and when is it efficient to divide out the factor first?”. We liked that the students could show both ways and determine which route to take.
Our big commitments to this flow chart method:
- Start with the concrete/visual. This is not a substitute for chips/cups nor the tape diagram. This is the next step for students who need it.
- Next year, use the flow chart when exploring simplifying expressions so we can build on that understanding for solving equations.
- Use friendly numbers (NUMBER CHOICES MATTER!!!) first to build understanding.
- Bring in some messier problems to seal the deal and discuss different moves they can make based on the given numbers in the equation.
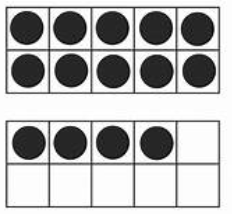
 What is the same about each? If I am thinking about this as a partitive model and using base 10 blocks, I am sorting the amount I am given into 3 equal groups each time.
 (Note: You can also include the symbols <, =, >, but I prefer to work on the concept FIRST then introduce the symbolic notation later.) Place the post-its on a workspace that has lots of room.
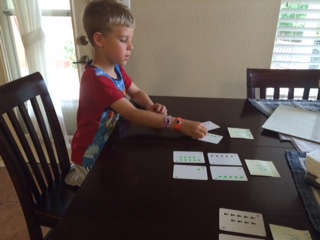 k and place two cards face-up for the child, but if students are playing in small groups they take turns taking the top two cards and placing them face-up. The child decides whether the sum is less than 10, the same as 10, or more than 10. If in small group, the others confirm or debate. Once the value is established, the student puts the cars face up as a pair under the correct post-it.
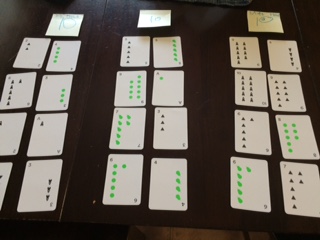

 r we used with those groups: 3, 5, 5 (upside down), 8, 10, 12, 15, 14, 20, 18. 18 was tough (see the number of dots), as students really needed to push to 5’s versus counting 10 then by ones.
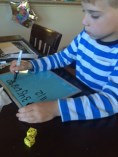


 Player 2: Roll dice, count on, and place the object on her game board. Continue until someone reaches the top of a column.