Equations and “Flow Charts”

A group of seventh grade teachers and I were trying to figure out how to move from concrete representations of solving equations (some used chips/cups and some used tape diagrams) to the more symbolic procedural (traditional) representation. While students were able to model the “moves” with the concrete, some still struggled to move from that to solving on paper.

I had recalled a method a dear colleague, Bruce Grip, had shown me years ago using a flow chart. We decided to try it out ourselves.

Starting with expressions, we discussed what the “moves” are when simplifying. Order of operations made a showing, and we moved through the flow chart. We decided this was a valuable use of time, as it built understanding of the structure of numeric expressions and fluency with integers (Which, let’s be honest; they need LOTS of practice with!). IMG_1854   IMG_1856

IMG_1857

From there, we decided to bust out a single step equation. We started the same way we did with expressions, using x as our starting value. “What moves am I making to x in this equation?” We then built our flow chart. HOWEVER, rather than simplifying (as in the expressions), we know the value we want to get. So the flow chart looks like this:

IMG_1858

To solve for the value of x, we need to work backIMG_1859wards through our flow chart. If I had added 2 to a value to get -5, then I need to subtract that 2 to figure out what I started with. We could then parallel the flow chart with the more traditional algorithm for the students.

Below are several of our examples, limited to the structures seventh grade explores for CCSS.

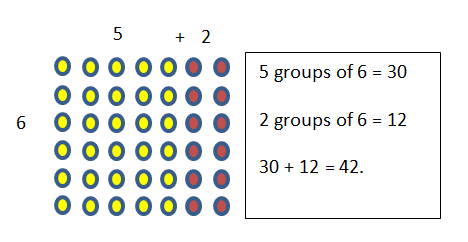
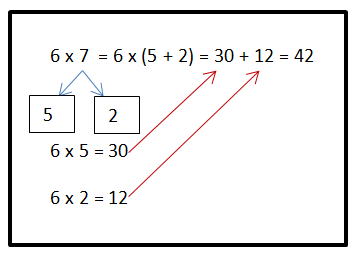
We also explored some “messier” problems, as shown here.IMG_1863 It illustrates the fluency with the distributive property piece of “When do I need to distribute and when is it efficient to divide out the factor first?”. We liked that the students could show both ways and determine which route to take.


Our big commitments to this flow chart method:

  1. Start with the concrete/visual. This is not a substitute for chips/cups nor the tape diagram. This is the next step for students who need it.
  2. Next year, use the flow chart when exploring simplifying expressions so we can build on that understanding for solving equations.
  3. Use friendly numbers (NUMBER CHOICES MATTER!!!) first to build understanding.
  4. Bring in some messier problems to seal the deal and discuss different moves they can make based on the given numbers in the equation.
Equations and “Flow Charts”

Why Distribute in Third Grade?

I am blessed to work with dedicated teachers who care deeply for their students and are working hard to understand the conceptual shifts CCSS brings to the table in math. One such teacher emailed me this weekend distraught, not knowing how to respond to a frustrated parent. The premise was the mother did not understand why her third grader was being asked to learn the distributive property, when she herself hadn’t learned it until Algebra I.

The arithmetic properties (commutative, associative, identities, etc.) were not created for Algebra I, though many of us didn’t learn them until then. I remember thinking that a bunch of old guys must have made them up for the sheer joy of torturing me into memorizing random stuff. No, the properties are the rules that give us the freedom to simplify math problems to make them easier to calculate while keeping the value the same.

An example. Which would be easier to solve in your head, 15 + 29 then add 5  OR  15 + 5 then add 29? The second, because we can make tens (15+5 = 20) and easily add 29 to it rather than have to “carry the 1” on the first example. This illustrates the commutative property: when adding or multiplying, I can perform that operation with any numbers in the problem first. I can switch the numbers around to make the problem easier to add (or multiply).

These properties should be celebrated as early as Kindergarten. Students do not necessarily need to know the names, but should realize through exploration that they exist and help them find their values.

Back to the distributive property. We old-timers saw it used like this: 6(5x + 2) = 30x + 12. This is not what we are asking third graders to do! Since the CCSSM standards require single digit multiplication fluency in third grade (1×1 through 9×9), it is natural to teach the distributive property at this level. This property allows me to break up one of my bigger numbers into parts. I can then multiply those smaller parts by the other factor to make it easier.

6 x 7 arrayExample: 6 x 7   This is always a toughie. Is it 48? 42? 56? I don’t know! Even if I draw an array (the above pic), that is a whole lot of dots to count!

But if I know my 5’s and 2’s, I can figure it out using the distributive property!             Break up the 7 into 5 and 2.   So now 6 x 7 becomes 6 x (5 + 2).    distribute array 6 x 7

I know 6 x 5 = 30.  (This is illustrated in yellow.)

I know 6 x 2 = 12 (This is illustrated in red.)

So 6 x (5 + 2) = 30 + 12 = 42.

distributive property 6 x 7

You may also see the distributive property used as a “number bond”. This is when it is broken up into parts, either using boxes or circles to show the parts. In this case, 7 is broken up into two parts:  5 and 2.

Utilizing the distributive property is an amazing strategy for students who struggle with memorization! They can use the distributive property to break up larger values they don’t know the multiplication facts for, until they have time to build fluency. More important, it teaches kids the value of knowing that math isn’t just memorization. There are structures and patterns that I can use. If I know the rules that govern those patterns (the properties), I can change the structure to find the value in an easier way. 

Why Distribute in Third Grade?